AUD/JPY Price Forecast: Finds initial support at 94.00, aligns with nine-day EMA
- AUD/JPY may approach the upper boundary of the ascending channel of 95.20.
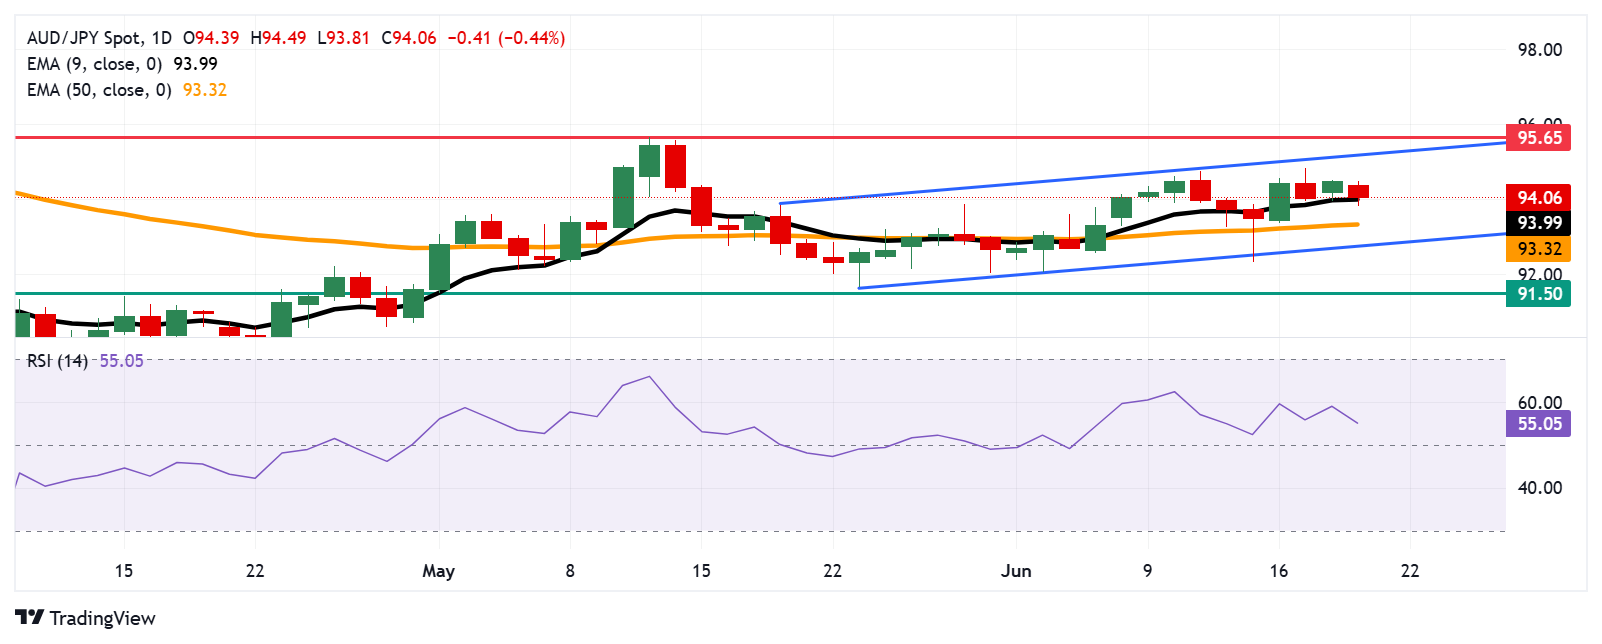
- Bullish bias strengthens as the 14-day RSI remains above the 50 mark.
- The nine-day EMA at 93.99 acts as the immediate support.
AUD/JPY retraces its recent gains registered in the previous day, trading around 94.10 during the European hours on Thursday. As per the technical analysis of the daily chart, the currency cross moves upwards within an ascending channel pattern, indicating a bullish bias.
The 14-day Relative Strength Index (RSI) remains above the 50 level, strengthening the bullish bias. Additionally, the AUD/JPY cross is positioned slightly above the nine-day Exponential Moving Average (EMA), suggesting short-term price momentum is stronger. A break below this level would indicate a weakening price momentum.
On the upside, the AUD/JPY cross could explore the area around the upper boundary of the ascending channel of 95.20. A break above the channel would reinforce the bullish bias and support the pair to approach the three-month high at 95.65, which was marked on May 13.
The AUD/JPY cross is poised to test the primary support at the nine-day EMA of 93.99. A break below this level would weaken the short-term price momentum and put downward pressure on the pair to target the 50-day EMA at 93.32, followed by the ascending channel’s lower boundary around 92.80. Further decline below this crucial support zone would cause the emergence of the bearish bias and prompt the pair to fall toward the two-month low at 91.50, which was recorded on May 1.
AUD/JPY: Daily Chart
Australian Dollar PRICE Today
The table below shows the percentage change of Australian Dollar (AUD) against listed major currencies today. Australian Dollar was the weakest against the Swiss Franc.
| USD | EUR | GBP | JPY | CAD | AUD | NZD | CHF | |
|---|---|---|---|---|---|---|---|---|
| USD | 0.05% | 0.01% | 0.12% | 0.17% | 0.61% | 0.77% | -0.37% | |
| EUR | -0.05% | -0.03% | 0.03% | 0.06% | 0.49% | 0.65% | -0.47% | |
| GBP | -0.01% | 0.03% | 0.08% | 0.09% | 0.52% | 0.79% | -0.25% | |
| JPY | -0.12% | -0.03% | -0.08% | 0.00% | 0.35% | 0.56% | -0.43% | |
| CAD | -0.17% | -0.06% | -0.09% | -0.00% | 0.35% | 0.61% | -0.34% | |
| AUD | -0.61% | -0.49% | -0.52% | -0.35% | -0.35% | 0.32% | -0.84% | |
| NZD | -0.77% | -0.65% | -0.79% | -0.56% | -0.61% | -0.32% | -1.08% | |
| CHF | 0.37% | 0.47% | 0.25% | 0.43% | 0.34% | 0.84% | 1.08% |
The heat map shows percentage changes of major currencies against each other. The base currency is picked from the left column, while the quote currency is picked from the top row. For example, if you pick the Australian Dollar from the left column and move along the horizontal line to the US Dollar, the percentage change displayed in the box will represent AUD (base)/USD (quote).
 Copy Link
 Share on Facebook
 Share on X
 Share by Email